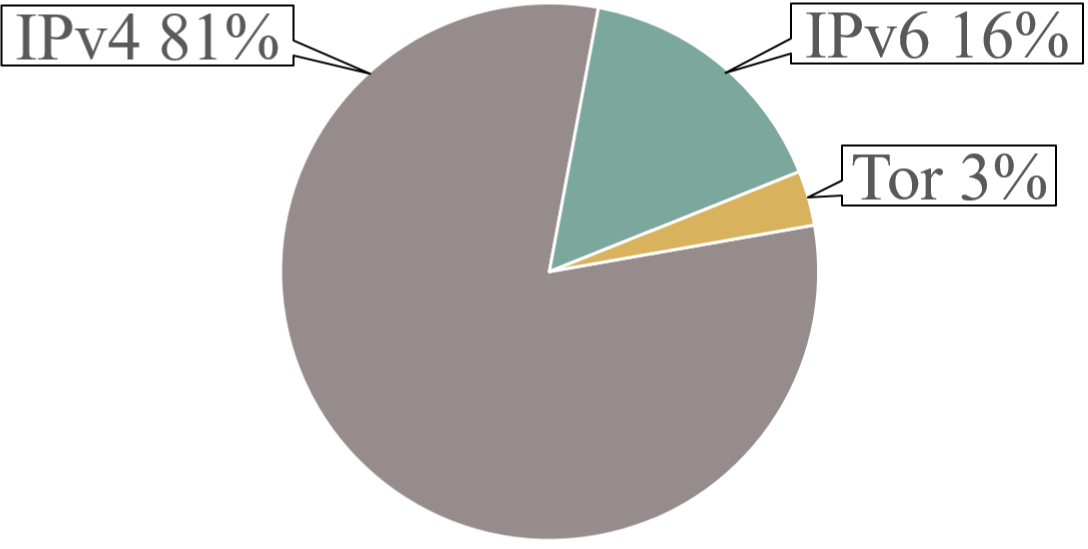
Distribution of 5743 full nodes obtained from bitnodes.21.co/ (Jan 9th, 2017)
The Bitcoin network is similar to a living organism. It continuously undergoes rapid changes in terms of distribution, size, and quality of its components. Its evolution impacts the security and the performance of the whole system.
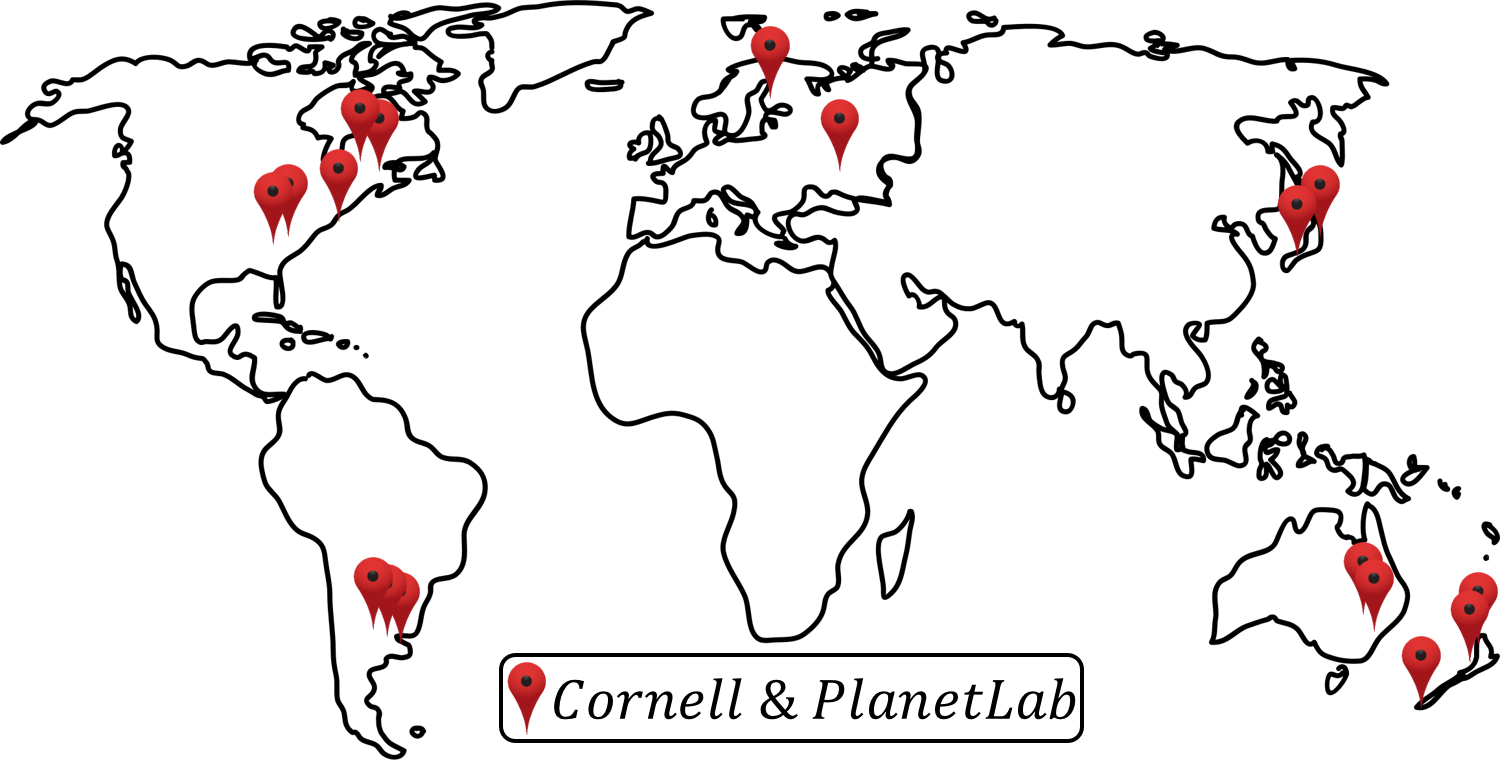
The current measurement infrastructure is built on 17 nodes
We have been observing the ongoing evolution of the Bitcoin network with a measurement tool that actively collects data from the actual network. Our measurement tool consists of long-running processes executing on a globally distributed infrastructure that spans 5 continents. We have been continuously collecting data regarding the provisioned bandwidth of peers, peer-to-peer latency, and protocol-level network traffic for Bitcoin nodes connected over IPv4, IPv6, and Tor nodes.
We have been using this tool to populate the data for the Miniature World system, whose goal is to replicate the entire Bitcoin network at 1:1 scale in the basement of our department in order to evaluate protocols.
In this post, we want to highlight some of the interesting discoveries from our last batch of measurements in the process of characterizing the Bitcoin network.
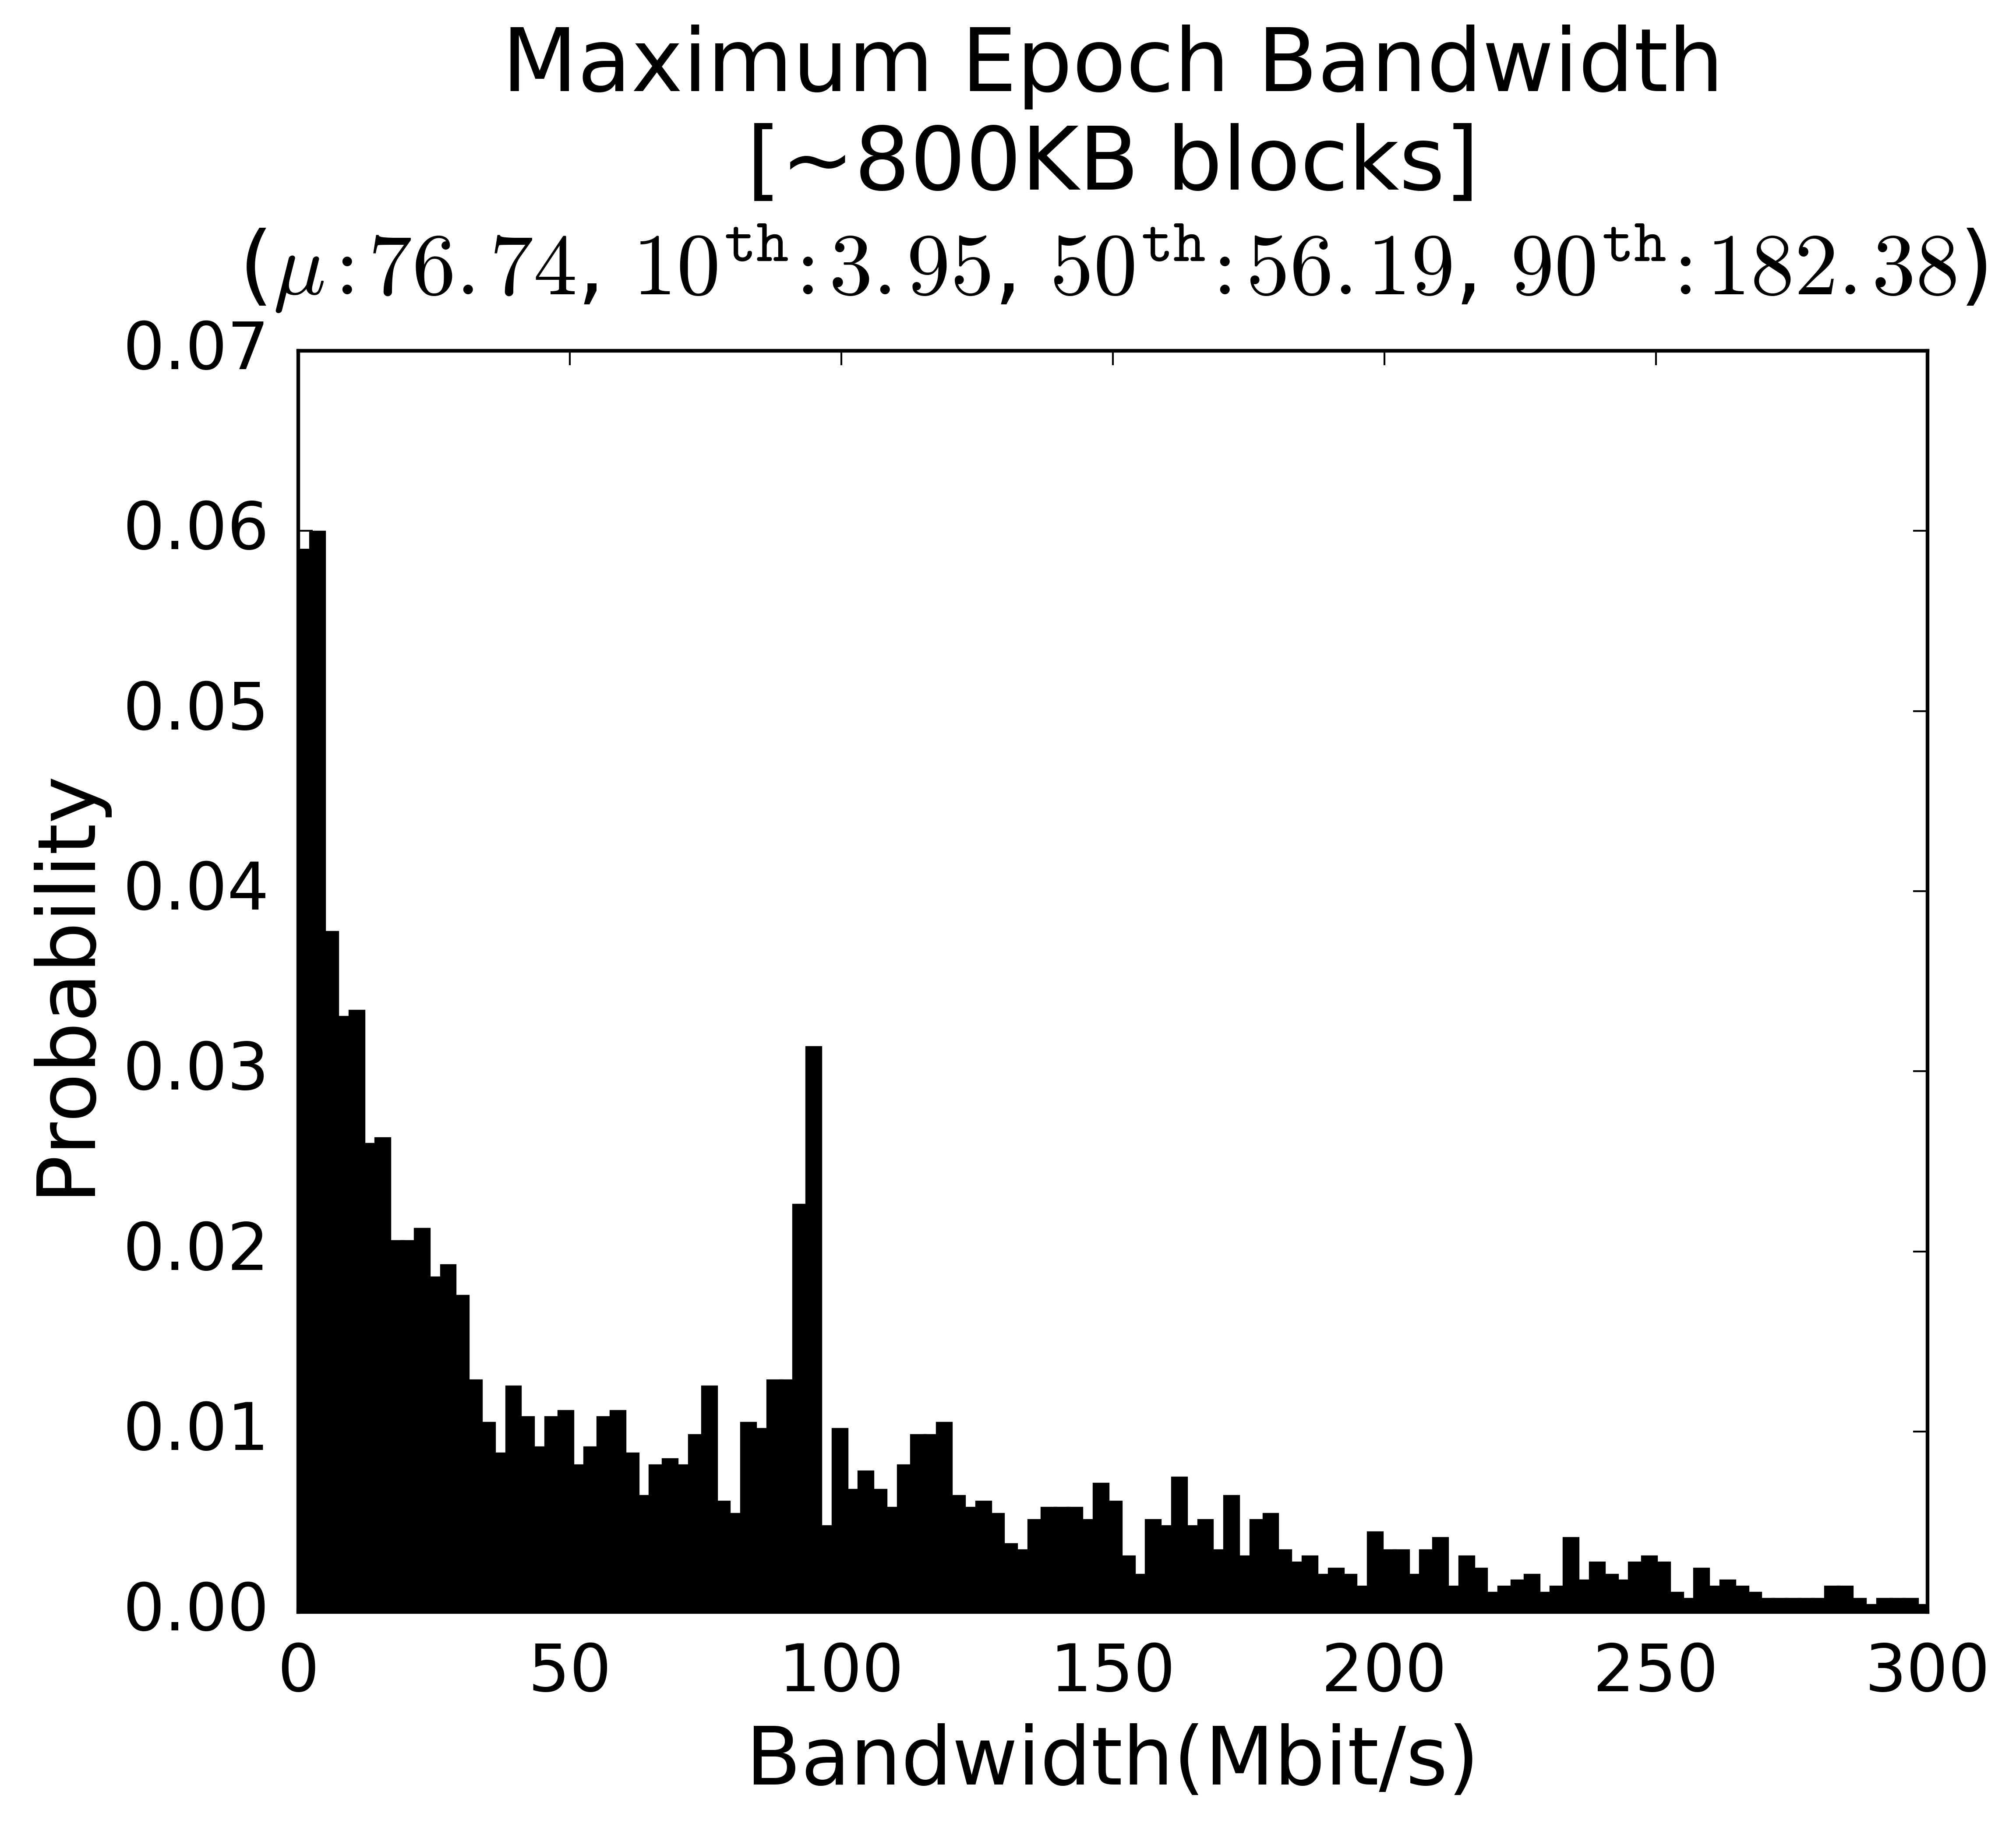
Provisioned bandwidth is estimated using the maximum epoch bandwidth
Provisioned bandwidth is a lower bound on the estimated transmission bandwidth of a Bitcoin node. It typically corresponds to the limits imposed by its last-mile connection to the Internet. Provisioned bandwidth forms the bottleneck for a bitcoin peer to receive/transmit blocks, transactions, and corresponding metadata. Higher provisioned bandwidth lets miners propagate/collect blocks to/from the network faster. Our tool measures provisioned bandwidth by requesting a large number of blocks from each peer, dividing the time into epochs and, for each epoch, measuring the bandwidth either until all requested data is received or a predefined timeout is reached. The maximum observed bandwidth in any epoch is the provisioned bandwidth we plot in this section and the next.
The figure shows the provisioned bandwidth measurements for IPv4 peers. Peaks around 10 and 100 Mbit/s regions represent typical bandwidth capacities of a home user, and a typical Amazon EC2 Bitcoin instance. Overall, most nodes seem to be connected at speeds over 5 Mbit/sec. Only about 10% of the nodes have a capacity under 5 Mbit/s and the median is over 50 Mbit/s. The long tailed distribution shows that there exist some nodes with considerably high bandwidth capacities, around 300Mbit/s.
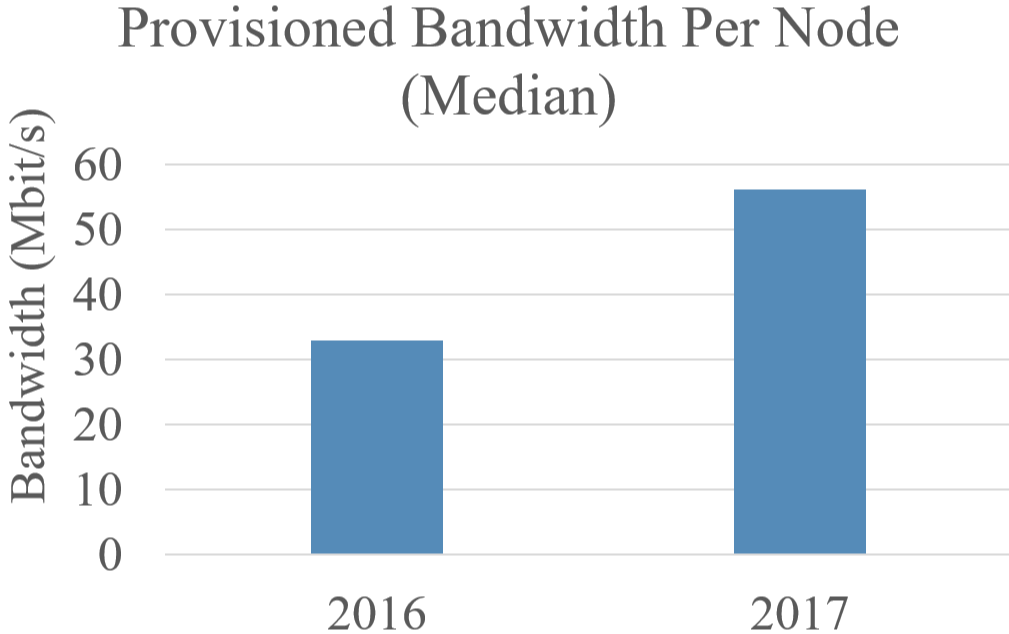
Evolution of provisioned bandwidth (IPv4 nodes)
Perhaps our most interesting discovery is that the Bitcoin network has improved tremendously in terms of its provisioned bandwidth.
The measurements show that Bitcoin nodes, which used to be connected to the network at a median speed of 33 Mbit/s in 2016 (See our related paper) are now connected at a median speed of 56 Mbit/s. In other words, the provisioned bandwidth of a typical full node is now 1.7X of what it was in 2016. The network overall is 70% faster compared to last year.
Of course, every measurement study in the real world is subject to experimental limitations and even expected errors. Our study might yield incorrect provisioned bandwidths if (1) the bottleneck on the path lies on the side of the measurement apparatus, and not the measured nodes (i.e. not in the access network a.k.a. "the last mile," or on a link close to the measured node that other nodes contacting the same node would also have to traverse), (2) other traffic near the measurement apparatus interferes with the measurements to make #1 true during a measurement, or (3) if the measured nodes shape traffic in a way that is specific to the measurement apparatus (e.g. throttle it). We have taken great pains to ensure that #1 and #2 errors are minimized. #3 is unlikely given what we know about the predominant client software and nodes' operational procedures. And conditions are sufficiently similar between last year's measurements and this year's such that measurement errors, to the extent they exist, would tend to cancel each other out. In short, we believe there is a genuine speedup in the entire network.
The provisioned bandwidth of a node plays a critical role in determining system parameters, such as the maximum block size. The increase in provisioned bandwidth suggests that, for people who were happy with the level of decentralization that Bitcoin exhibited last year, blocks can now be made 1.7X larger without impacting their centralization concerns, assuming that these measurements capture the state of the network.
That last assumption is subject to the caveat that our study examined the entire network, whereas centralization concerns impact the miners. One could push forward the argument that the network conditions between miners are not reflected by the conditions between regular nodes, that the miners evolved differently from the rest of the network over the last year. We look forward to seeing such arguments made scientifically and with quantitative data, as well as seeing other measurement studies that repeat our measurements and bring new raw data into the maximum block size debate.
Finally, do keep in mind that provisioned bandwidth is not the only metric that affects the maximum block size debate. We encourage the community to discuss these findings in a spirit of scientific inquiry, which starts by accepting objective measurements as what they are.
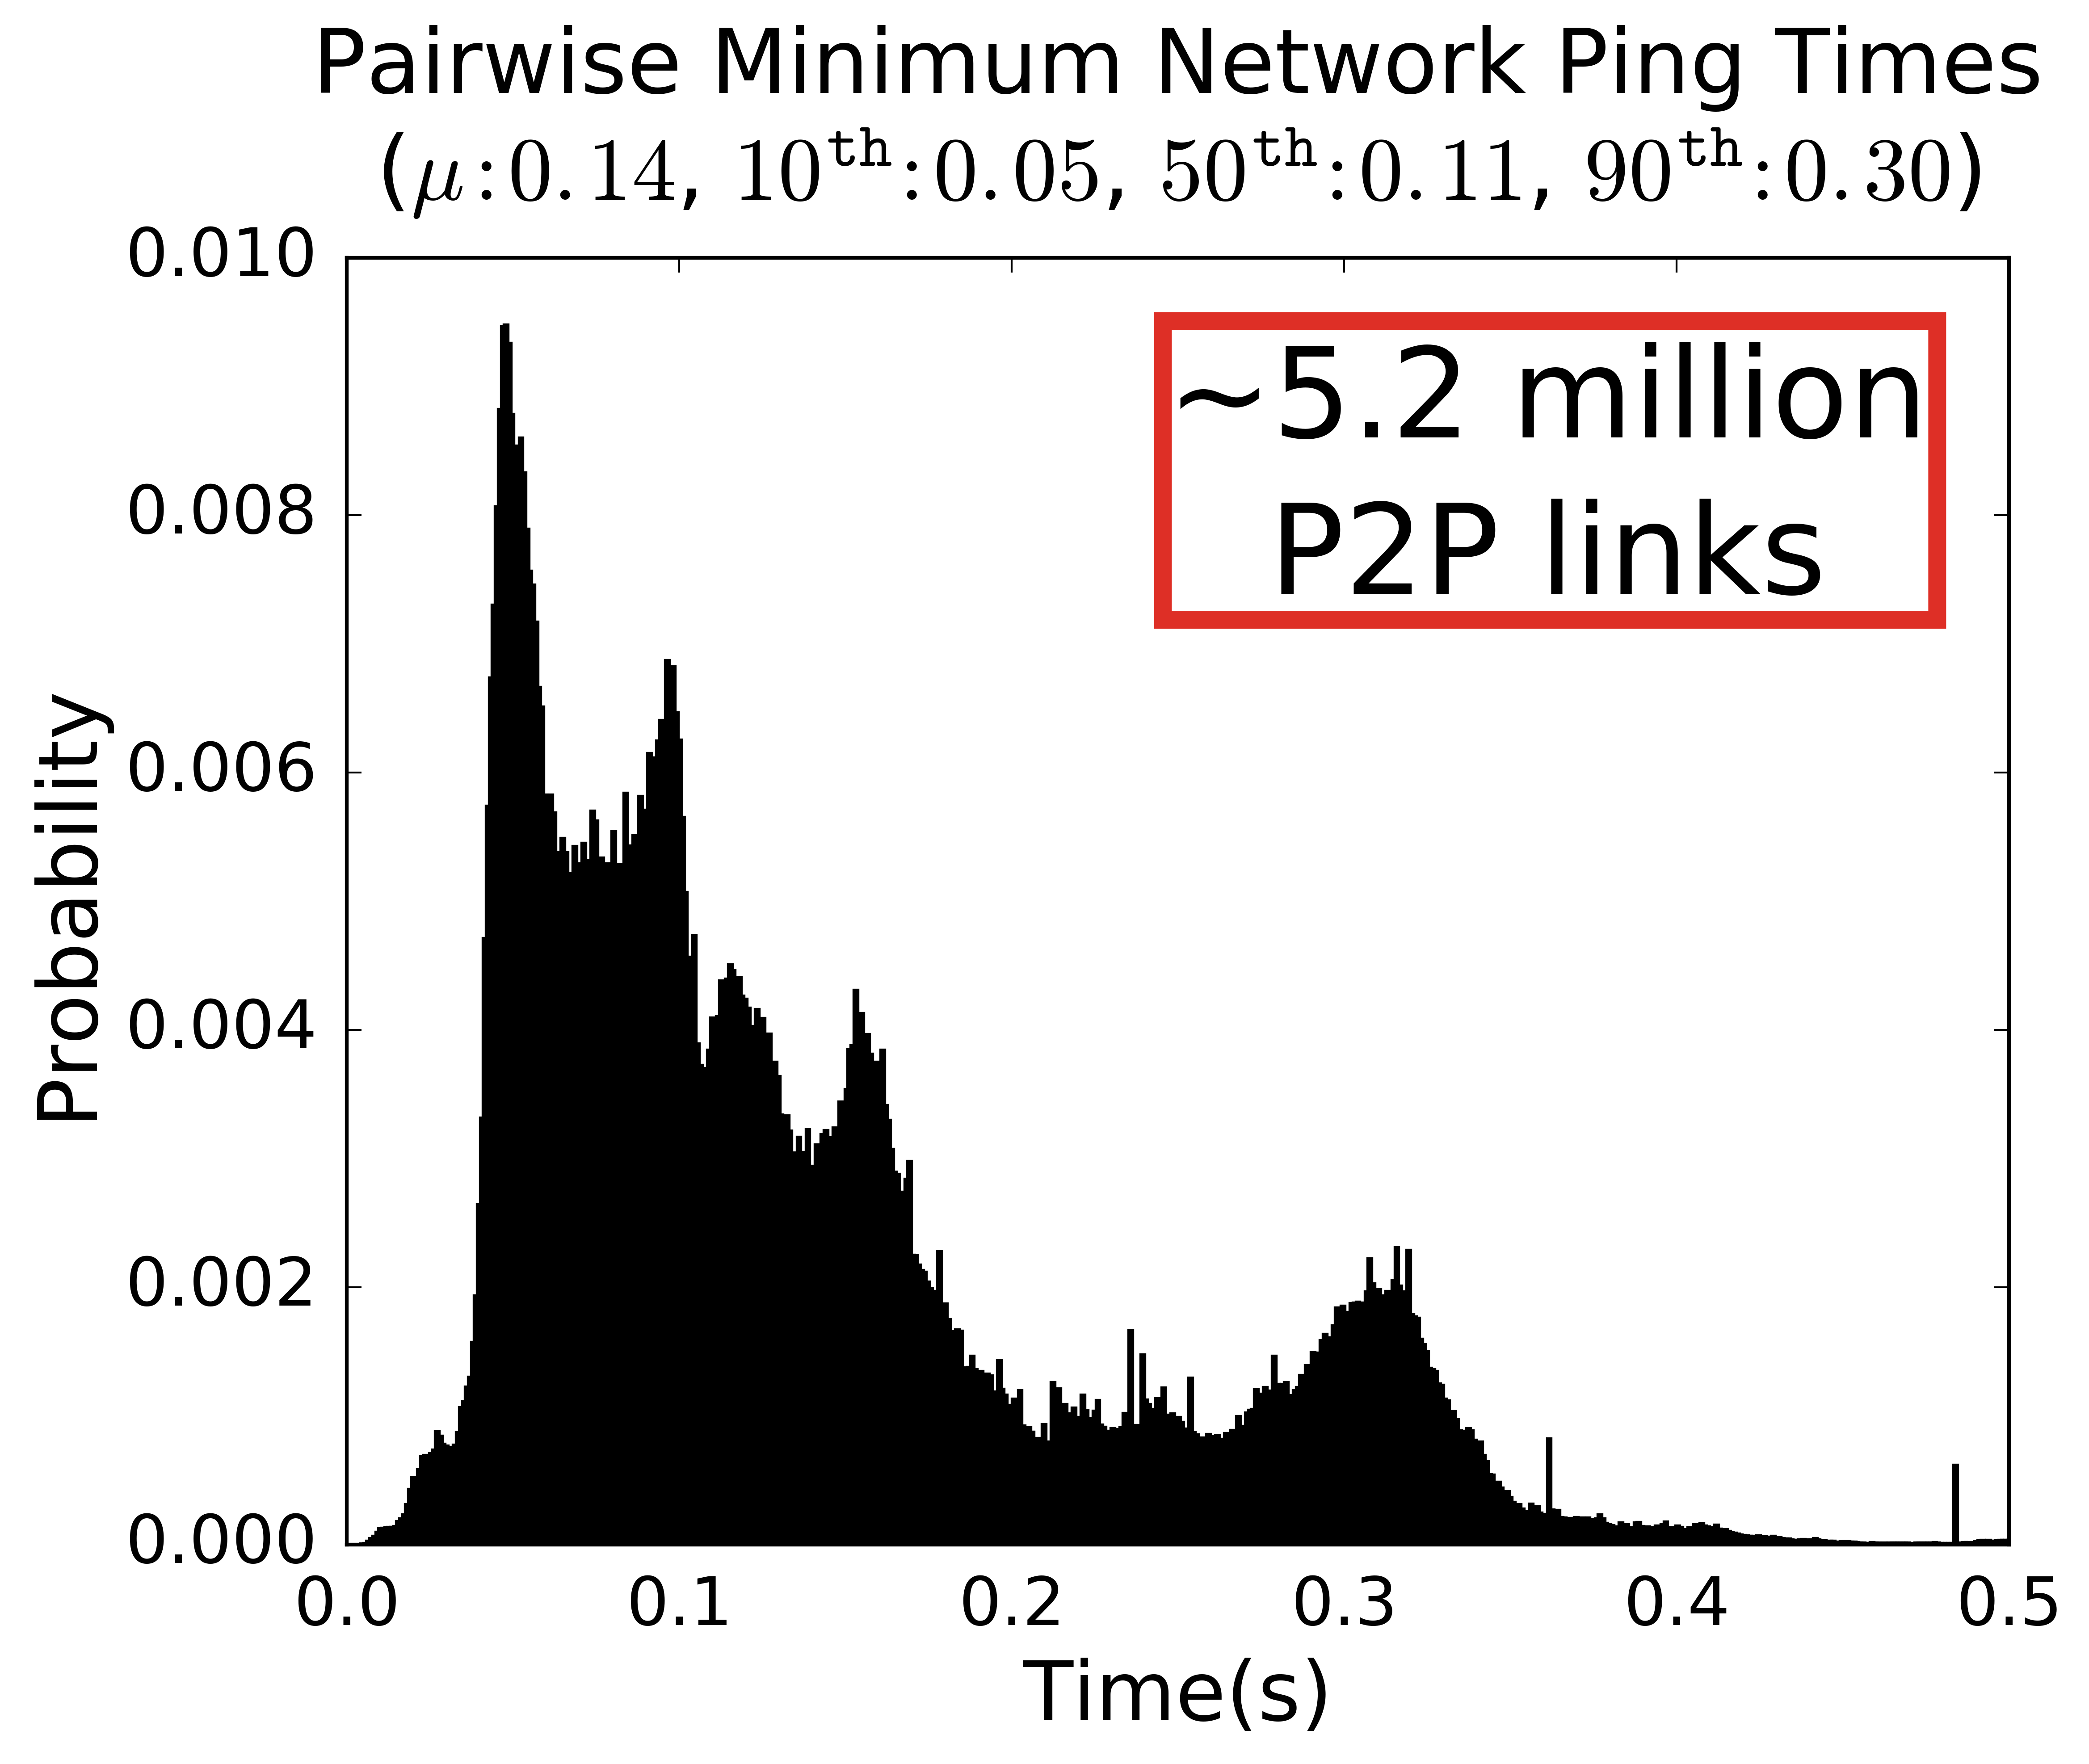
The network latency between peers impacts the block and transaction propagation times. To estimate the P2P latency, the measurement tool relies on latency measurements from multiple beacons. First, for each pair of peers, it measures the latency to peers from a single vantage point. Using triangle inequality, it estimates upper and lower bounds for the latency between peers. Then it repeats this process from other vantage points to obtain a set of bounds for each such measurement. Finally, the measurement tool determines a range for the estimated latency between each peer by picking the maximum from lower bounds and the minimum from the upper bounds.
The figure shows the estimated mid-range latency of virtual links between IPv4 peers. The results indicate that the median latency of peers is around 110 ms.
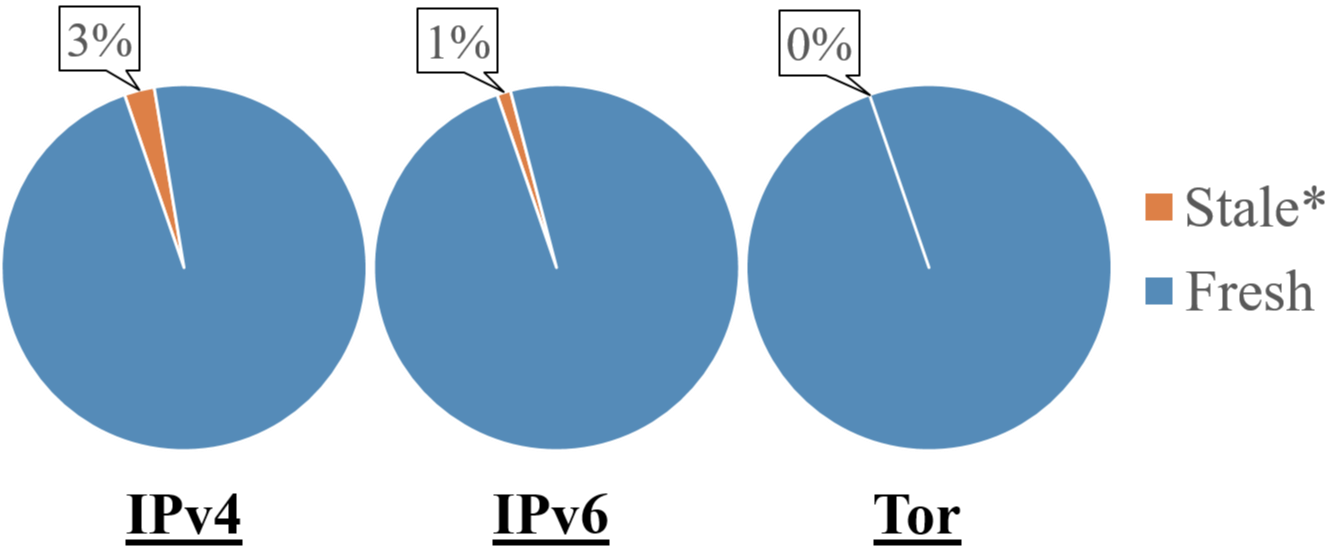
Distribution of stale peers as of Jan 2017
We define a peer as stale if its height is more than 1% behind the height of the best blockchain. Compared to a fresh peer, a stale peer is likely to experience a heavier network traffic due to the potential bootstrapping process. The measurement tool extracts the height field from the version messages to identify such peers in the Bitcoin network. It collects version messages from each peer during the protocol handshake.
Our results indicate that about 2.6% of IPv4 nodes and 1% of IPv6 nodes are stale. All Tor nodes were fresh, which might indicate that at the time of these measurements, no recent Tor node has joined the network.
A stale rate of 2.6% is unexpectedly high. One hypothesis is that these nodes are forever behind the main chain because they are unable to catch up due to their bandwidths being too limited relative to the block size. We evaluated this hypothesis by examining the provisined bandwidths of these nodes. Of the 92 stale IPv4 nodes, 71 responded to our provisioned bandwidth measurement. Their bandwidths were mean 124 Mbits/s, 10th percentile at 7.6 Mbits/s, median at 110 Mbits/s, and 90th percentile at 310 Mbits/s. These statistics are higher than the general population across the board, showing that this hypothesis is false. These nodes do not have slow connections, and their staleness is not due to an inability to catch up due to bandwidth limitations.
We performed a followup study where we examined the level of staleness of the stale nodes. Of the 92 stale IPv4 nodes, 74 responded to this followup. Of these 74, 62 have the same height as before -- i.e. they do not try to catch up. We suspect that a software error is keeping these nodes from making forward progress.
To identify the varying power of miners in the Bitcoin network, we examined the weekly distribution of mining power in a one-year period. Mining power estimation is based on the ratio of blocks generated by miners. In Bitcoin, miners voluntarily provide the identity information as part of each block they mine.
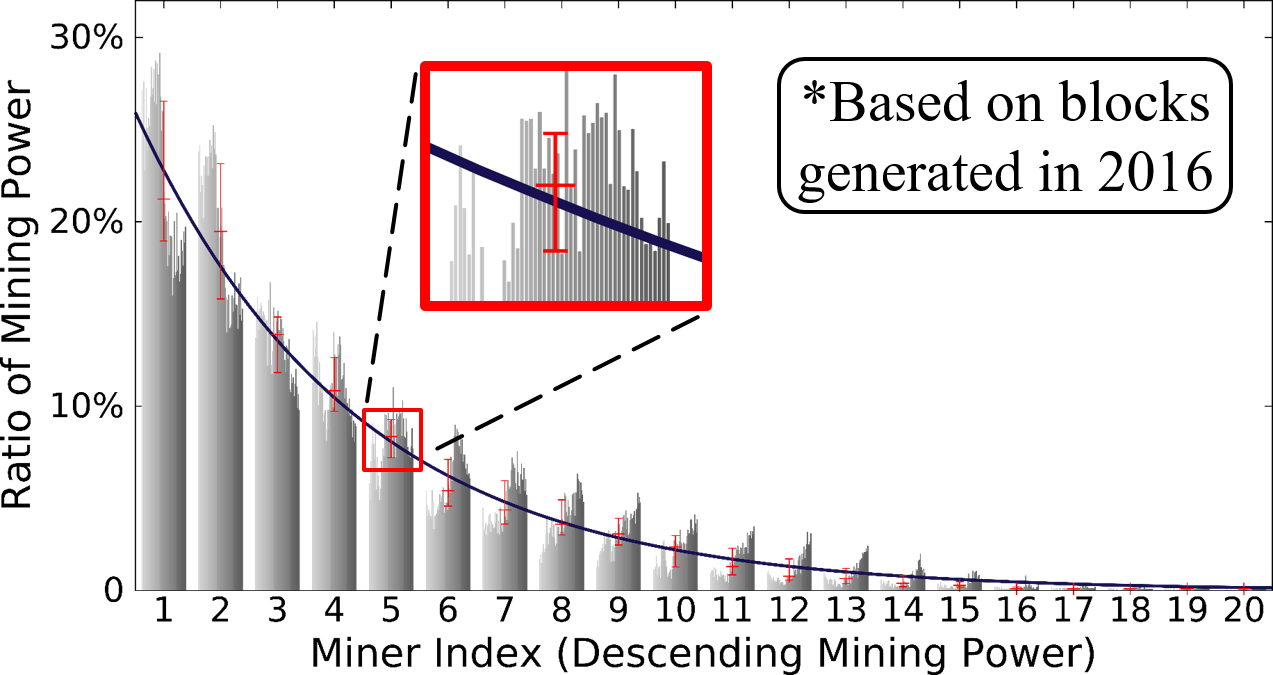
The trendline passes through the median of each batch.
For each week of 2016, we calculated the corresponding mining power of peers. We assigned index 1 to the largest weekly mining power, index 2 to the second one, and so on. Figure shows the top 20 weekly mining power distribution. Each batch of bars represents the collection of weekly mining power ratios. Note that miners not necesarily preserve their index throughout different weeks. The results show that the weekly mining power of a single miner has never exceeded the 30% of the overall mining power in 2016. Morever, in the second half of the year, the highest mining power has consistently been under the 20% range.
The details of our measurements are now available in slides, and there is a corresponding video presentation on Miniature World talk at BPASE '17.

Dr. Gencer is a researcher at LinkedIn. His thesis research focused on improving the scalability of blockchain technologies. more...

Hacker and professor at Cornell, with interests that span distributed systems, OSes and networking. Current projects include HyperDex, OpenReplica and the Nexus OS. more...


bitcoin / security / ethereum / hyperdex / release / nosql / selfish-mining / blocksize / dao / surveillance / privacy / mongo / broken / weaver / nsa / meta / leveldb / blockchain / 51% / voting / smart contracts / graph stores / decentralization / bitcoin-ng / vaults / snowden / satoshi / philosophy / mt. gox / mining pools